2016 Crop Tour – Sponsored by Perkins & Co Resources
- January 26, 2017
- Posted by: GIAV
- Categories: Industry-News, News
First tour gets a preview of a big crop
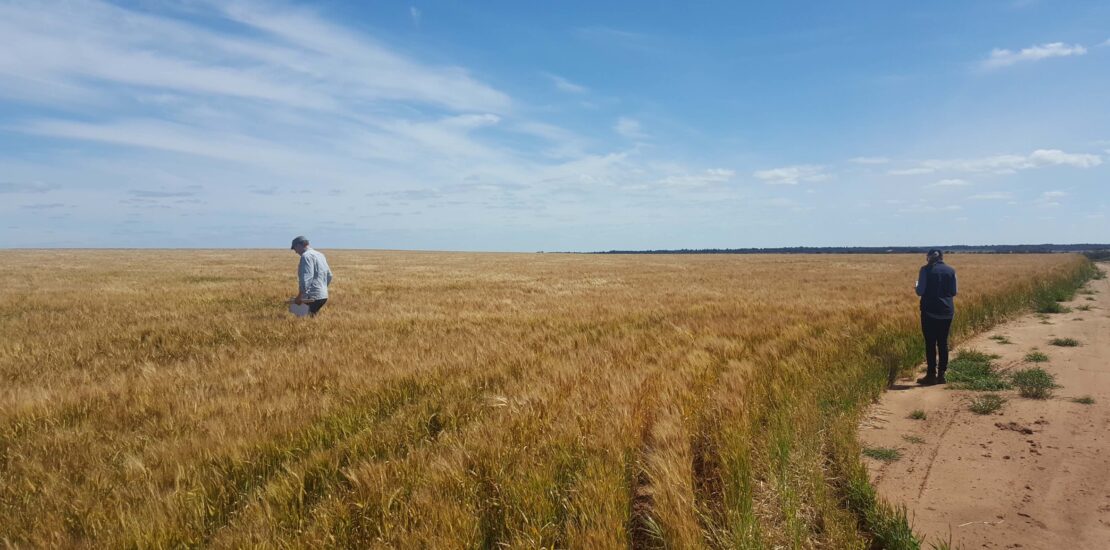
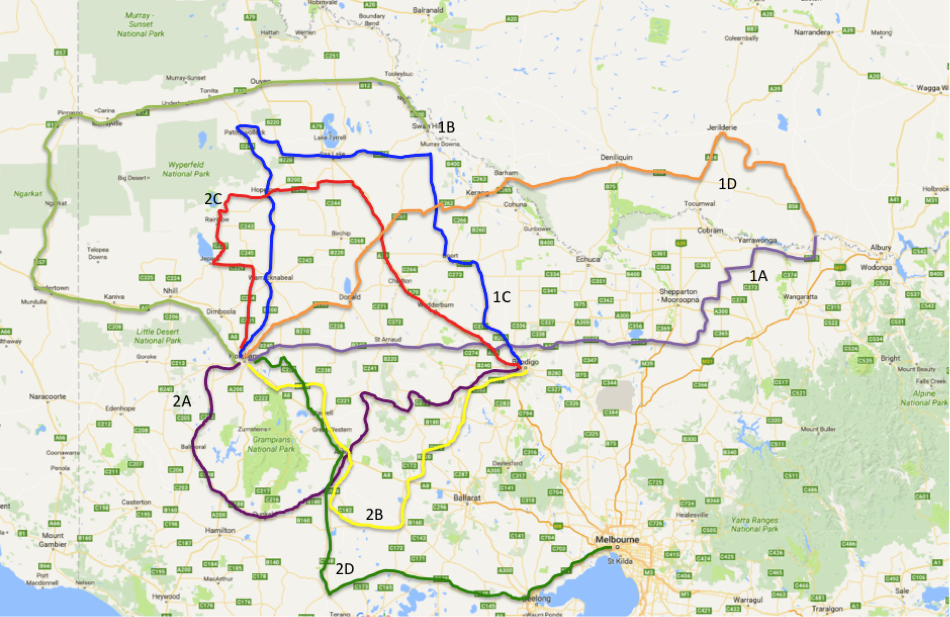
On October 19 and 20, 29 people in 8 cars, travelled over 7,500 kms and surveyed 245 paddocks of wheat and barley across Victoria and southern NSW.
This was the first Grain Industry Association of Victoria pre-harvest Crop Tour and the team of crop assessors concluded that overall grain production in Victoria will be above average this year.
Observations
Like much of eastern Australia, most production areas in Victoria have received decile 10 rainfall during the growing season which places 2016 within the wettest 10 per cent on record. Despite this and reports of a few wet paddocks, most crops were not showing any obvious signs of waterlogging.
In the Wimmera and southern regions, the crop tour reported some crops with heavy weed infestation, attributed to the inability of paddocks to support machinery for herbicide applications.
Many barley crops in the Wimmera and Mallee had infestations of net blotch fungus, which can limit limit grain fill in dry years but may not have a great impact this season. Lodging of barley was common in most areas particularly in the more southern areas. There were a number of reports of slight frost damage in wheat crops of the central Mallee.
Participants
On the Crop Tour was a blend of GIAV members, interstate grain merchants and analysts, agronomists and students from the University of Melbourne studying for their Masters Degree in Agriculture. This mix of people helped provided some great networking opportunities while on the road and during the evening briefings.
Methodology
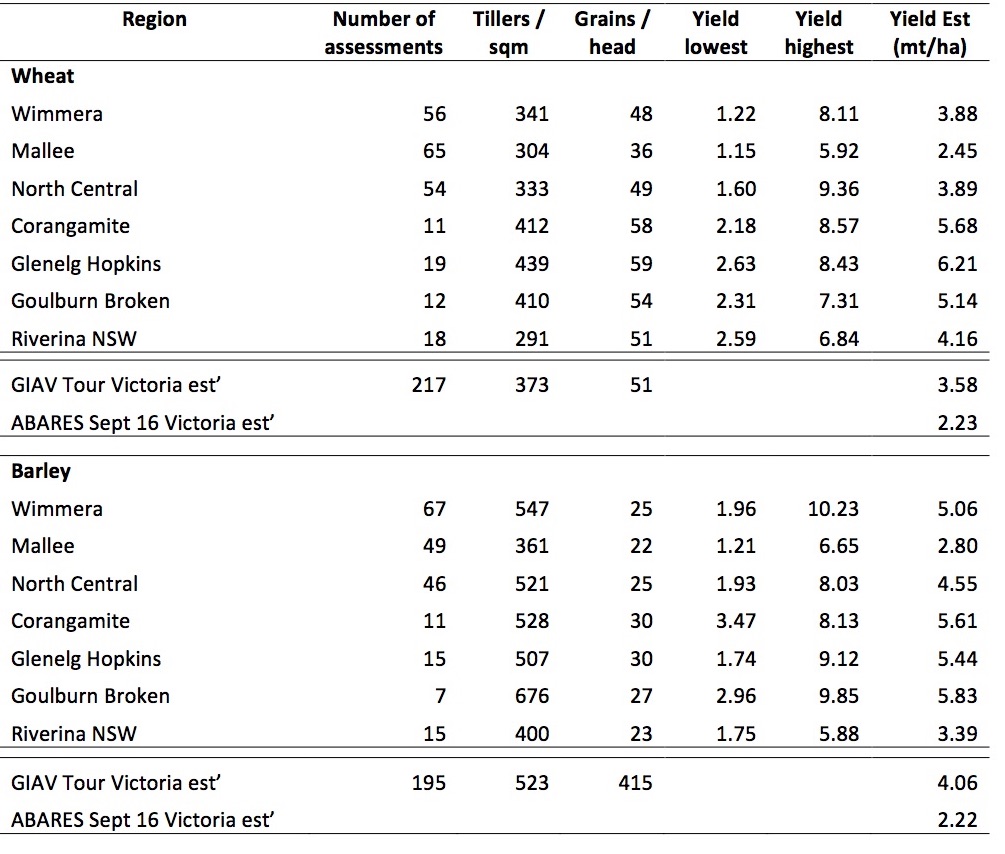
The yield estimates are modelled from tillers or heads per m2, grains per head and grain weight factors commonly used by agronomists. While this is the first year of the Tour and these yield estimates are higher than other industry estimates, this data is provided for consideration by industry in good faith.
The grain weights used are 0.028 g for wheat and 0.035 g for barley, which are not the highest possible but, do assume good soil moisture for grain fill. The wheat yield has been corrected with a 0.82-floret factor to account for fewer florets in other spikelets higher in each head. (Reference Seed Development and Germination)
Results may include elements of bias and statistical errors but all reasonable attempts have been made to avoid them. The paddocks that were selected for assessment, the portions of the paddock assessed and the heads that were assessed can all contribute to bias. Yields are medians of the estimates for each region. Sterilizing boot wash kits were used to minimise any biosecurity risks.
In providing these Crop Tour results to industry, the GIAV would like to stress that it is expected that the estimates will provide greater value in several years time when year on year comparisons can be made. Agronomists and analysts have highlighted that raw data such as this can provide yields higher than actual.
The GIAV does not undertake planted area surveys and the limited sample size limits the capacity to directly extrapolate robust production estimates from his data.
GIAV 2016 Crop Tour Survey Summary for 2016/17 season
The GIAV wishes to thank grain growers for their support, technical advice from Sabine Tausz-Posch and Dale Grey and Perkins & Co Resources for their on-going sponsorship of this and future Crop Tours.
