- October 30, 2017
- Posted by: Colin Peace
- Category: News
Second tour estimates yields back 16 to 20%
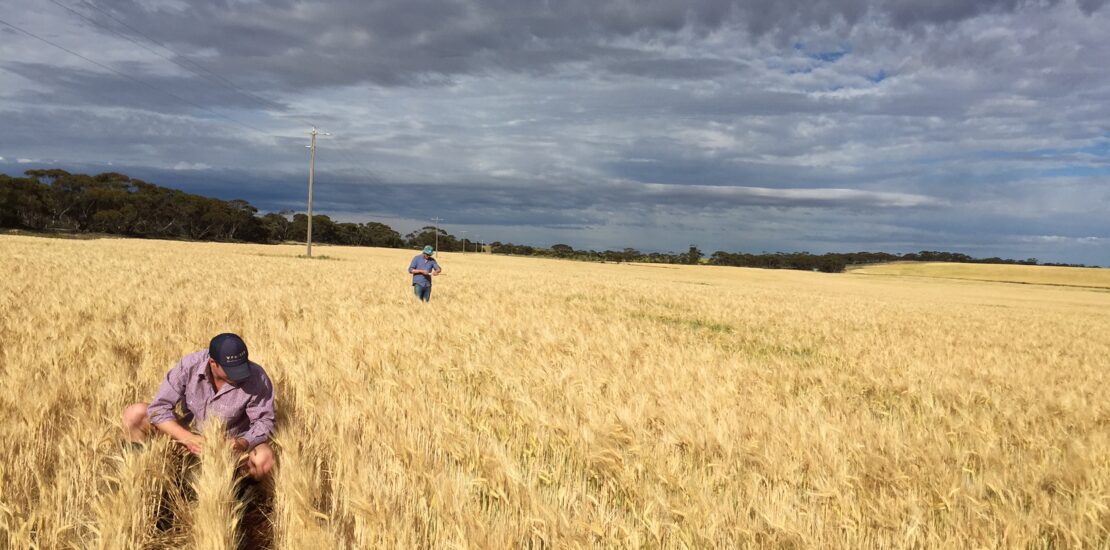
On October 18 and 19, 35 people in 12 cars, travelled over 11,800 kms and surveyed 305 paddocks of wheat and barley across Victoria and southern NSW.
As this is the second Grain Industry Association of Victoria pre-harvest Crop Tour, results from the team of crop assessors concluded that wheat yields in Victoria are estimated to 20% lower and barley yields are estimated to be 16% lower than last year’s record yields.
Observations
Unlike areas to the north, most production areas in Victoria have received average rainfall during the growing season (decile 4-7). Crop assessors reported a few paddocks are suffering the impacts of head and stem frost and mice damage, especially in southern NSW and the Mallee.
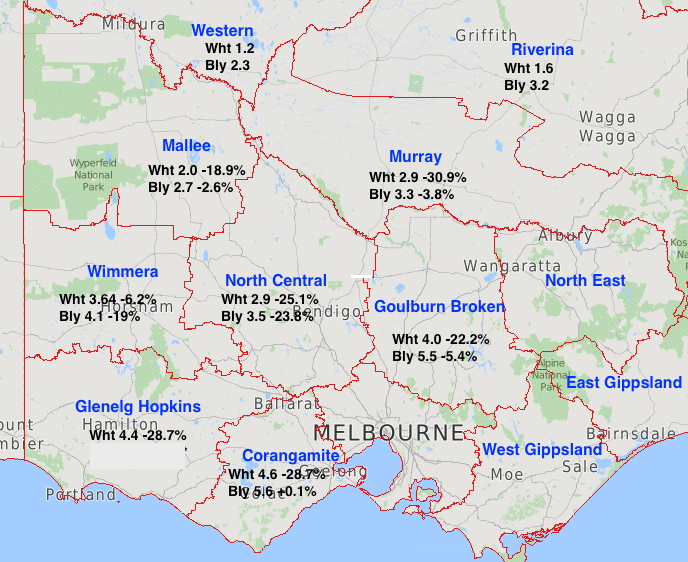
Regions assessed and 2017 yields (t/ha) compared to 2016 (%)
Participants
Assessors on the Crop Tour were GIAV members, interstate grain merchants and analysts, agronomists and students from the University of Melbourne studying for their Masters Degree in Agriculture. This mix of people helped provide some great networking opportunities while on the road and during the evening briefings.
Methodology
The yield estimates are modelled from tillers or heads per m2, grains per head and grain weight factors commonly used by agronomists. The grain weights used are 0.028 g for wheat and 0.035 g for barley, which are not the highest possible, but do assume good soil moisture for grain fill. The wheat yield has been corrected with a 0.82-floret factor to account for fewer florets in other spikelets higher in each head. (Reference Seed Development and Germination)
Results may include elements of bias and statistical errors but all reasonable attempts have been made to avoid them. The paddocks that were selected for assessment, the portions of the paddock assessed and the heads that were assessed can all contribute to bias. Yields are medians of the estimates for each region. Sterilizing boot wash kits were used to minimise any biosecurity risks.
Agronomists and analysts have highlighted that raw data such as this can provide yields higher than actual. The GIAV does not undertake planted area surveys and the limited sample size limits the capacity to directly extrapolate robust production estimates from his data, but value can be gained from year on year comparisons.
GIAV 2017 Crop Tour Survey Summary
| Region | No of assessments | Yield Est (t/ha) | Change % | ||
| (NRMR) |
2016 |
2017 | 2016 | 2017 | 2016 to 2017 |
| Wheat | |||||
| Wimmera |
58 |
88 | 3.88 | 3.64 |
-6.2% |
| Mallee |
65 |
126 | 2.45 | 1.99 |
-18.9% |
| North Central |
54 |
98 | 3.89 | 2.91 |
-25.1% |
| Corangamite |
11 |
13 | 5.68 | 4.60 |
-19.0% |
| Glenelg Hopkins |
19 |
4 | 6.21 | 4.42 |
-28.7% |
| Goulburn Broken |
12 |
64 | 5.14 | 4.00 |
-22.2% |
| Murray (NSW) |
18 |
34 | 4.16 | 2.87 |
-30.9% |
| Riverina (NSW) |
0 |
29 | 1.65 | ||
| Western (NSW) |
0 |
11 | 1.20 | ||
| Totals |
237 |
467 |
|||
| GIAV Tour Estimate Victoria |
3.58 |
2.85 |
-20.2% |
||
| ABARES Estimate Victoria |
3.35 |
2.26 |
|||
| Barley | |||||
| Wimmera |
67 |
63 | 5.06 | 4.10 |
-19.0% |
| Mallee |
49 |
97 | 2.80 | 2.73 |
-2.6% |
| North Central |
46 |
62 | 4.55 | 3.47 |
-23.8% |
| Corangamite |
11 |
3 | 5.61 | 5.61 |
0.1% |
| Glenelg Hopkins |
15 |
2 | 5.44 | 2.10 |
-61.4% |
| Goulburn Broken |
7 |
59 | 5.83 | 5.52 |
-5.4% |
| Murray (NSW) |
15 |
14 | 3.39 | 3.26 |
-3.8% |
| Riverina (NSW) |
0 |
10 | 3.12 | ||
| Western (NSW) |
0 |
4 | 2.28 | ||
| Totals |
210 |
314 |
|||
| GIAV Tour Estimate Victoria |
4.06 |
3.42 |
-15.7% |
||
| ABARES Estimate Victoria | 3.40 |
2.22 |
|||
The Mallee and Murray region barley yields appear high and may represent a different cross section of paddocks compared to last year’s tour. One of the barley paddocks in the Glenelg Hopkins region was completely frosted.
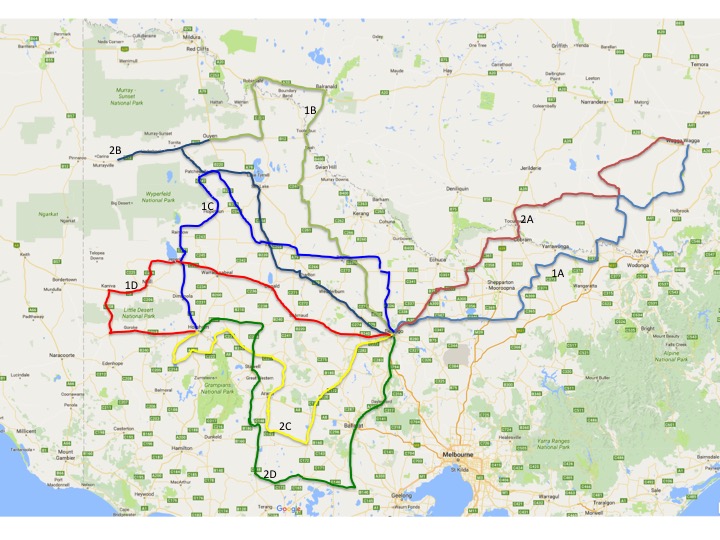
Routes
The GIAV wishes to thank our crop assessors for their diligence, grain growers for their support, Dale Grey of Agriculture Victoria for his technical advice and Perkins & Co Resources for their on-going sponsorship of the GIAV Crop Tour.
